> ## Documentation Index
> Fetch the complete documentation index at: https://docs.witting.ai/llms.txt
> Use this file to discover all available pages before exploring further.
# Actor Insights
> How to configure Insights for your Vocalis AI Actor. Define the structured data points — scores, text, and charts — that get extracted from every conversation.
Insights are the structured data points that Vocalis extracts from each conversation. Instead of just giving you a raw transcript, the AI Actor pulls out the specific information you care about — scores, key answers, and visual breakdowns.
You configure Insights in **Step 3 (Insights)** of the AI Actor setup wizard.
 ## Auto-generating insights
Click **Auto-generate Insights** to let the AI suggest a starting set of insights based on your Actor's purpose. You can edit or remove any of the generated insights afterward.
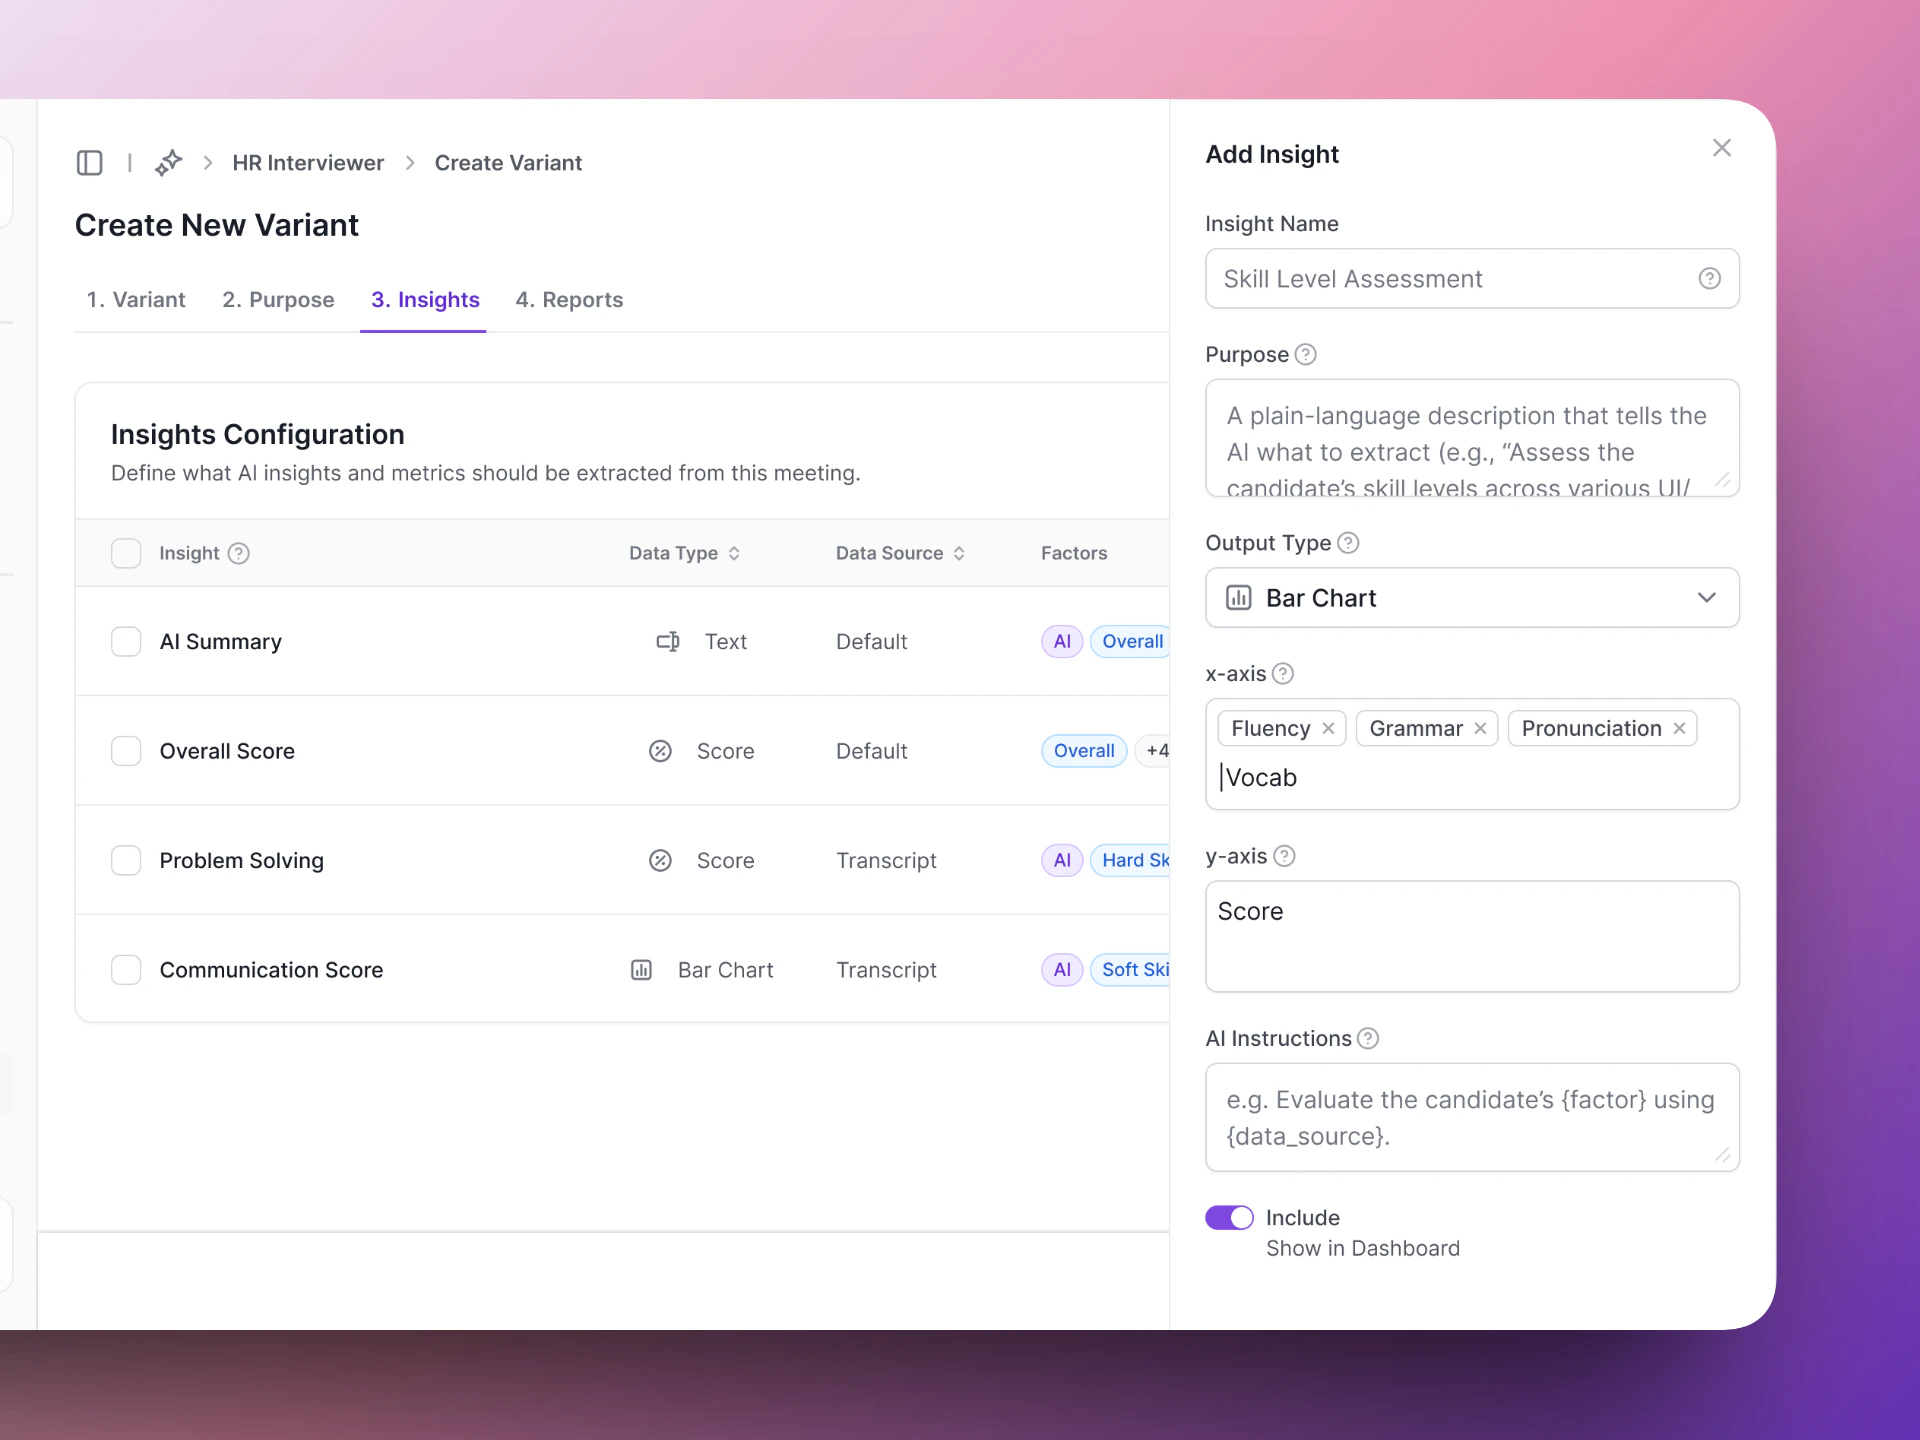
## Adding an insight manually
Click **+ Add Insight** to open the side panel. Fill in the following fields:
| Field | What it means |
| ------------------------------ | ---------------------------------------------------------------------------------------------------------------------------------------------------------------------------------------- |
| **Insight Name** | A label for the data point (e.g., "Skill Level Assessment"). |
| **Purpose** | A plain-language description that tells the AI what to extract (e.g., "Assess the candidate's skill levels across various UI/UX competencies and visualize the scores on a bar chart."). |
| **Output Type** | How the data is displayed — Text, Score, Bar Chart, Line Chart, or Pie Chart. |
| **Factors** | The breakdown categories to measure against (e.g., design thinking, user research, interaction design). Only applies to chart output types. |
| **Y Axis (Label)** | The measurement label for the vertical axis (e.g., "Skill Level (out of 10)"). Only applies to chart output types. |
| **Show in insights & reports** | Toggle whether this insight appears in the meeting results dashboard. |
## Insight output types
| Type | Best for | Example |
| -------------- | --------------------------------- | ---------------------------------------------------------------------------- |
| **Text** | Open-ended answers, summaries | "AI Summary", "Salary expectations" |
| **Score** | Numeric ratings, years, counts | "Overall Score", "Years of experience" |
| **Bar Chart** | Comparing categories side by side | "Skill Level Assessment" broken down by design thinking, user research, etc. |
| **Line Chart** | Trends or progression | "Engagement level over time" |
| **Pie Chart** | Distribution or composition | "Technology stack breakdown" |
## Insights table columns
Each insight in the configuration table shows:
| Column | What it means |
| ------------- | --------------------------------------------------------------------------------------------- |
| **Insight** | The name of the data point. |
| **Data Type** | The output type — Text, Score, Bar Chart, Line Chart, or Pie Chart. |
| **Factors** | Tags showing the breakdown categories for the insight (e.g., design thinking, user research). |
| **Include** | Toggle to include or exclude the insight from reports without deleting it. |
| **Actions** | Menu to view, edit, or delete the insight. |
## Writing good purpose descriptions
The purpose description tells the AI what to look for. The more specific you are, the more accurate the extraction.
```
Name: Skill Level Assessment
Purpose: Assess the candidate's skill levels across various
UI/UX competencies and visualize the scores on a bar chart.
Factors: design thinking, user research, interaction design,
visual design, problem-solving
Y Axis: Skill Level (out of 10)
```
```
Name: Skills
Purpose: Check skills.
```
## Example insights
Here is a set of insights for a UI/UX interview AI Actor:
| Insight name | Data type | Factors |
| ------------------------------- | --------- | -------------------------------------- |
| Overall Summary | Text | candidate strengths, +3 |
| Overall Score | Score | design thinking, user research, +3 |
| Important Question with Excerpt | Text | important question, candidate response |
| Skill Level Assessment | Bar Chart | design thinking, user research, +3 |
| Usability Awareness Evaluation | Pie Chart | usability principles, +3 |
Start with 4-8 insights. Too few and you miss useful data. Too many and the AI spreads its attention thin. Focus on the data points your team actually uses to make decisions.
## Next steps
Test your insights before going live.
See how insights appear after a conversation.
## Auto-generating insights
Click **Auto-generate Insights** to let the AI suggest a starting set of insights based on your Actor's purpose. You can edit or remove any of the generated insights afterward.
## Adding an insight manually
Click **+ Add Insight** to open the side panel. Fill in the following fields:
| Field | What it means |
| ------------------------------ | ---------------------------------------------------------------------------------------------------------------------------------------------------------------------------------------- |
| **Insight Name** | A label for the data point (e.g., "Skill Level Assessment"). |
| **Purpose** | A plain-language description that tells the AI what to extract (e.g., "Assess the candidate's skill levels across various UI/UX competencies and visualize the scores on a bar chart."). |
| **Output Type** | How the data is displayed — Text, Score, Bar Chart, Line Chart, or Pie Chart. |
| **Factors** | The breakdown categories to measure against (e.g., design thinking, user research, interaction design). Only applies to chart output types. |
| **Y Axis (Label)** | The measurement label for the vertical axis (e.g., "Skill Level (out of 10)"). Only applies to chart output types. |
| **Show in insights & reports** | Toggle whether this insight appears in the meeting results dashboard. |
## Insight output types
| Type | Best for | Example |
| -------------- | --------------------------------- | ---------------------------------------------------------------------------- |
| **Text** | Open-ended answers, summaries | "AI Summary", "Salary expectations" |
| **Score** | Numeric ratings, years, counts | "Overall Score", "Years of experience" |
| **Bar Chart** | Comparing categories side by side | "Skill Level Assessment" broken down by design thinking, user research, etc. |
| **Line Chart** | Trends or progression | "Engagement level over time" |
| **Pie Chart** | Distribution or composition | "Technology stack breakdown" |
## Insights table columns
Each insight in the configuration table shows:
| Column | What it means |
| ------------- | --------------------------------------------------------------------------------------------- |
| **Insight** | The name of the data point. |
| **Data Type** | The output type — Text, Score, Bar Chart, Line Chart, or Pie Chart. |
| **Factors** | Tags showing the breakdown categories for the insight (e.g., design thinking, user research). |
| **Include** | Toggle to include or exclude the insight from reports without deleting it. |
| **Actions** | Menu to view, edit, or delete the insight. |
## Writing good purpose descriptions
The purpose description tells the AI what to look for. The more specific you are, the more accurate the extraction.
```
Name: Skill Level Assessment
Purpose: Assess the candidate's skill levels across various
UI/UX competencies and visualize the scores on a bar chart.
Factors: design thinking, user research, interaction design,
visual design, problem-solving
Y Axis: Skill Level (out of 10)
```
```
Name: Skills
Purpose: Check skills.
```
## Example insights
Here is a set of insights for a UI/UX interview AI Actor:
| Insight name | Data type | Factors |
| ------------------------------- | --------- | -------------------------------------- |
| Overall Summary | Text | candidate strengths, +3 |
| Overall Score | Score | design thinking, user research, +3 |
| Important Question with Excerpt | Text | important question, candidate response |
| Skill Level Assessment | Bar Chart | design thinking, user research, +3 |
| Usability Awareness Evaluation | Pie Chart | usability principles, +3 |
Start with 4-8 insights. Too few and you miss useful data. Too many and the AI spreads its attention thin. Focus on the data points your team actually uses to make decisions.
## Next steps
Test your insights before going live.
See how insights appear after a conversation.